Debugging with pry-byebug: moving in the stack frame
It is a truth universally acknowledged that a single developer in possession of a good codebase must be in want of a bug-free application 1.
Alas, debugging never ends. The more you learn, the more debugging becomes complex.
I think it is high time we dive deeper into pry-byebug. Are you new to pry-byebug? Go and check the beginners introduction to debugging your code first.
Here our menu du jour: moving in the stack frame, adding breakpoints on the fly, and some handy shortcuts (because who loves to write continue continually).
Step into the stack frame: step
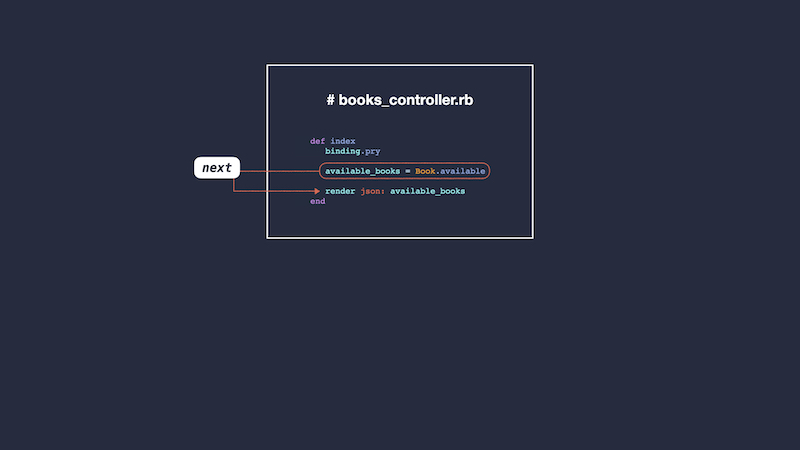
I discovered step only recently. One easy way to understand step is to explain it in contrast to next.
next executes the next line in your current context. step steps into the specific context - the frame - of the next line in your code.
The following example is a basic endpoint that allows me to get all available books and a Book model with a class method.
  # app/controllers/books_controller.rb
  class BooksController < BaseController
    def index
      binding.pry

      available_books = Book.available

      render json: available_books
    end
  end

  # app/model/book.rb
  class Book < ApplicationRecord
    def self.available
      where(available: true)
    end
  end
The breakpoint will pause execution before .available and open a debugging console.
  From: (pry) @ line 4 BooksController#index:

    01:   def index
    02:     binding.pry
    03:
 => 04:     available_books = Book.available
    05:
    06:     render json: available_books
    07:   end
When I type next, the result of Book.available is assigned to available_books and the execution stops before the next line.
  From: (pry) @ line 4 BooksController#index:

    01:   def index
    02:     binding.pry
    03:
    04:     available_books = Book.available
    05:
 => 06:     render json: available_books
    07:   end
What happened in Book.available? I don’t know. I only executed that line of code and stayed in my current frame - BooksController.
Let’s re-run my code and use step instead.
From: (pry) @ line 4 BooksController#index:
01: def index
02: binding.pry
03:
=> 04: available_books = Book.available
05:
06: render json: available_books
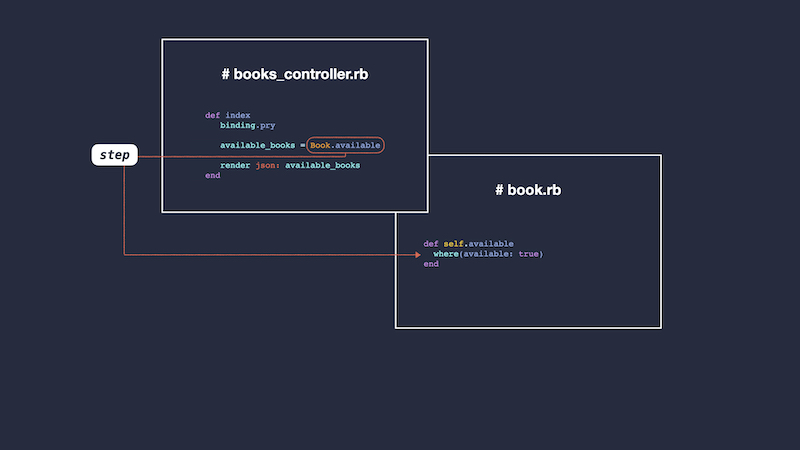
07: endTyping step takes me from my BooksController to my Book model. I’ve changed frames. I’m now exploring the class method Book.available.
  From: (pry) @ line 2 Book.available:

    01:   def self.available
 => 02:     where(available: true)
    03:   end
I can now check whether my class method works as intended.
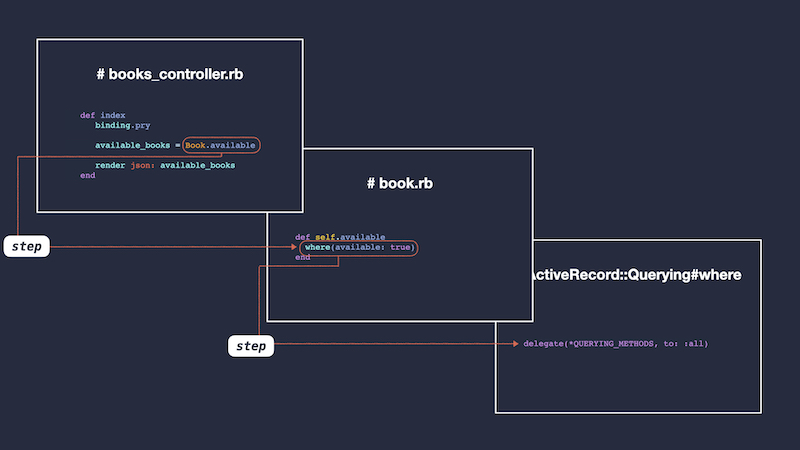
Disclaimer: step is a bit of a rabbit hole. It’s a great way to explore how Rails works. For instance, if I type step before where(available: true), my console returns:
  From: .rbenv/versions/2.6.5/lib/ruby/gems/2.6.0/gems/activerecord-6.0.3.4/lib/active_record/querying.rb:21 ActiveRecord::Querying#where:

 => 21: delegate(*QUERYING_METHODS, to: :all)`
Yep, I’m now checking out ActiveRecord’s inner gut.
Move up the stack frame: up
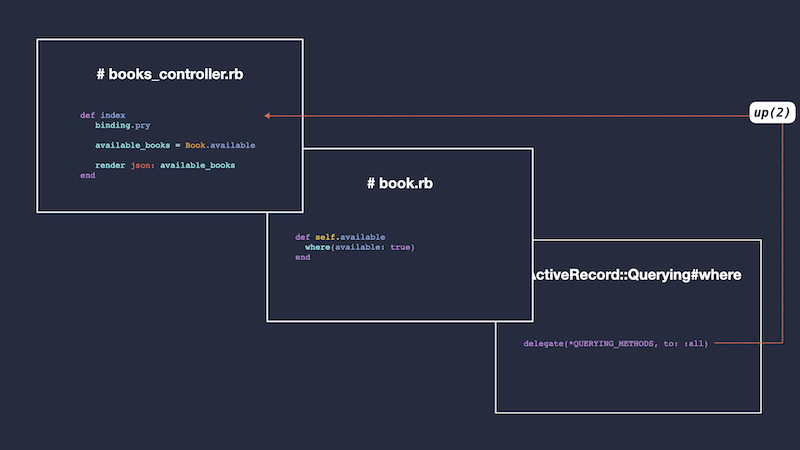
Remember when we dived into the frames? Well, how do I come back to my BooksController? With up, of course.
  From: (pry) @ line 2 Book.available:

    01:   def self.available
 => 02:     where(available: true)
    03:   end
If I type up in my console, I’ll move up the frames towards my initial breakpoint.
What if I’ve moved down frames several times? I can either pass the number of frames I’d like to go up as an argument - up(2) - or type up several times.
Add and remove breakpoints on the fly
1) Add a breakpoint from the console: break
If I realize, once I’m in my debugging console, that I would have needed another breakpoint, I can add it on the fly with break line_number.
  From: (pry) @ line 4 BooksController#index:

    01:   def index
    02:     binding.pry
    03:
 => 04:     available_books = Book.available
    05:
    06:     render json: available_books
    07:   end

  [1] pry(BooksController#index)> break 06

  Breakpoint 1: /path/controllers/books_controller.rb @ 06 (Enabled)

     01:   def index
     02:     binding.pry
     03:
     04:     available_books = Book.available
     05:
  => 06:     render json: available_books
     07:   end
I can type break 06, resume the execution, and have it paused before the render json.
A few things to consider:
-
Breakpoint 1: /path/controllers/books_controller.rb @ 06 (Enabled)gives me my new breakpoint reference number:1. This will come handly later. - What appears after
Breakpoint 1 ...is part of my breakpoint’s information. Not where my program is currently paused.
Adding breakpoint son the fly makes for a pretty seamless debugging experience. I used to exit the pry session, go back to my code, add a new breakpoint, then re-run execution. Let me tell you, break 06 came as a relief!
2) Remove a breakpoint from the console: break --delete breakpoint_number or break -D breakpoint_number
So, now my program is paused before the line 04, and I know I added a second breakpoint on the line 06:
  From: (pry) @ line 4 BooksController#index:

    01:   def index
    02:     binding.pry
    03:
 => 04:     available_books = Book.available
    05:
    06:     render json: available_books
    07:   end
What if I want to remove this second breakpoint?
First, I want to find my breakpoint’s reference by listing all breakpoints with break. Then, I can delete the breakpoint with break --delete breakpoint_number.
  [1] pry(BooksController#index)> break

  # Enabled At
  -------------

  1 Yes     /path/controllers/books_controller.rb @ 06


  [2] pry(BooksController#index)> break --delete 1

  # Enabled At
   -------------
break outputs the list of all the breakpoints added in the console.
break --delete breakpoint_number outputs the list of all remaining breakpoints.
3) Show breakpoints information: break --show breakpoint_number
  [1] pry(BooksController#index)> break --show 1

    Breakpoint 1: /path/controllers/books_controller.rb @ 06 (Enabled)

     01:   def index
     02:     binding.pry
     03:
     04:     available_books = Book.available
     05:
  => 06:     render json: available_books
     07:   end
This is the same output that the one I get after adding a breakpoint.
Check your latest commands: history
history gives me a list of all past commands I ran during the current pry session.
Commands and aliases
Finally, here’s a handy table with some commands and their aliases.
| command | alias | expected behavior |
|---|---|---|
wherami |
@ |
prints out your current context |
continue |
c |
continue program execution |
next |
n |
execute the next line in the current stack frame |
step |
s |
step execution into the next line |
break --delete |
break -D |
delete a breakpoint |
break --show |
break -s |
show a breakpoints details and source |
There’s only one thing left to say: Happy debugging!
Noticed something? Ping me on Twitter or create an issue on GitHub.
Cheers,
Rémi
-
Sorry, just re-read for the umpteenth time Pride and Prejudice. ↩