---
title: 'Debugging with pry-byebug: moving in the stack frame'
description: Time to level up your debugging game with frames, adding breakpoints
on the fly, and some handy shortcuts.
author:
name: Rémi Mercier
url: https://remimercier.com/about/
canonical_url: https://remimercier.com/pry-byebug-intermediate/
published: '2021-01-18'
language: en
topics:
- Debugging
site:
name: Rémi Mercier
url: https://remimercier.com
---
# Debugging with pry-byebug: moving in the stack frame
> Time to level up your debugging game with frames, adding breakpoints on the fly, and some handy shortcuts.
Published on 2021-01-18 by Rémi Mercier.
Original: https://remimercier.com/pry-byebug-intermediate/
It is a truth universally acknowledged that a single developer in possession of a good codebase must be in want of a bug-free application [^1].
Alas, debugging never ends. The more you learn, the more debugging becomes complex.
I think it is high time we dive deeper into `pry-byebug`. Are you new to `pry-byebug`? Go and check [the beginners introduction to debugging your code](/pry-byebug-tutorial/) first.
Here our _menu du jour_: moving in the stack frame, adding breakpoints on the fly, and some handy shortcuts (because who loves to write `continue` continually).
## Step into the stack frame: `step`
I discovered `step` only recently. One easy way to understand `step` is to explain it in contrast to `next`.
`next` executes the next line in your current context. `step` steps into the specific context - the **frame** - of the next line in your code.
The following example is a basic endpoint that allows me to get all available books and a `Book` model with a class method.
```ruby
# app/controllers/books_controller.rb
class BooksController < BaseController
def index
binding.pry
available_books = Book.available
render json: available_books
end
end
# app/model/book.rb
class Book < ApplicationRecord
def self.available
where(available: true)
end
end
```
The breakpoint will pause execution before `.available` and open a debugging console.
```irb
From: (pry) @ line 4 BooksController#index:
01: def index
02: binding.pry
03:
=> 04: available_books = Book.available
05:
06: render json: available_books
07: end
```
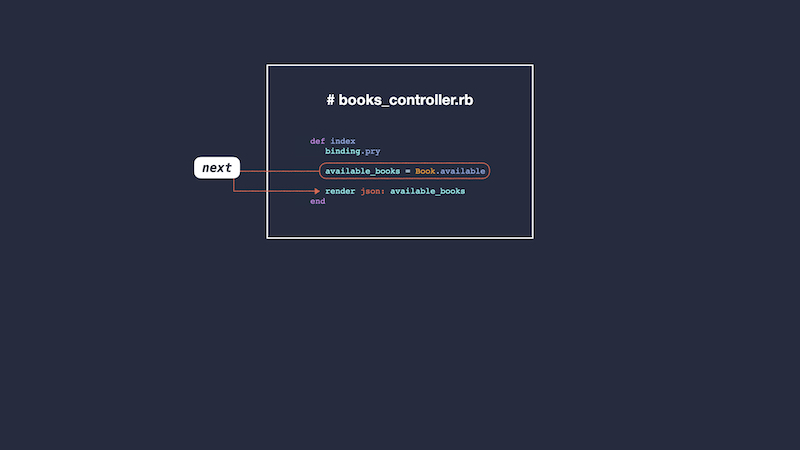
When I type `next`, the result of `Book.available` is assigned to `available_books` and the execution stops before the next line.
```irb
From: (pry) @ line 4 BooksController#index:
01: def index
02: binding.pry
03:
04: available_books = Book.available
05:
=> 06: render json: available_books
07: end
```
What happened in `Book.available`? I don't know. I only executed that line of code and stayed in my current frame - `BooksController`.
 Let's re-run my code and use `step` instead.
```irb
From: (pry) @ line 4 BooksController#index:
01: def index
02: binding.pry
03:
=> 04: available_books = Book.available
05:
06: render json: available_books
07: end
```
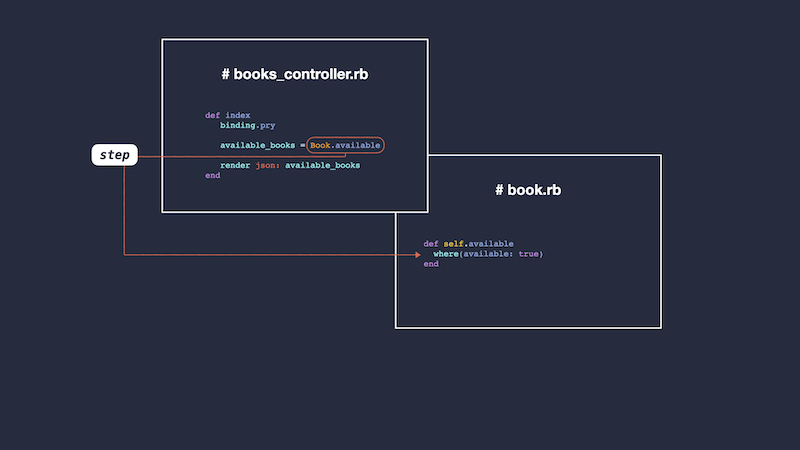
Typing `step` takes me from my `BooksController` to my `Book` model. I've changed frames. I'm now exploring the class method `Book.available`.
```irb
From: (pry) @ line 2 Book.available:
01: def self.available
=> 02: where(available: true)
03: end
```
I can now check whether my class method works as intended.
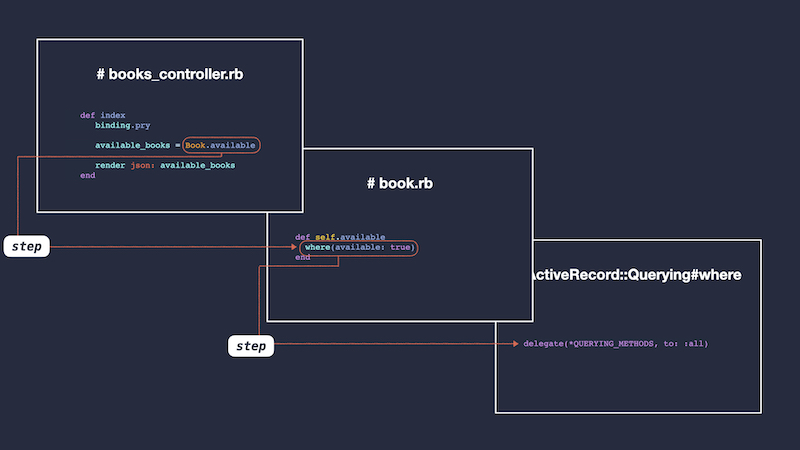
 Disclaimer: `step` is a bit of a rabbit hole. It's a great way to explore how Rails works. For instance, if I type `step` before `where(available: true)`, my console returns:
```irb
From: .rbenv/versions/2.6.5/lib/ruby/gems/2.6.0/gems/activerecord-6.0.3.4/lib/active_record/querying.rb:21 ActiveRecord::Querying#where:
=> 21: delegate(*QUERYING_METHODS, to: :all)`
```
Yep, I'm now checking out ActiveRecord's inner gut.
 ## Move up the stack frame: `up`
Remember when we dived into the frames? Well, how do I come back to my `BooksController`? With `up`, of course.
```irb
From: (pry) @ line 2 Book.available:
01: def self.available
=> 02: where(available: true)
03: end
```
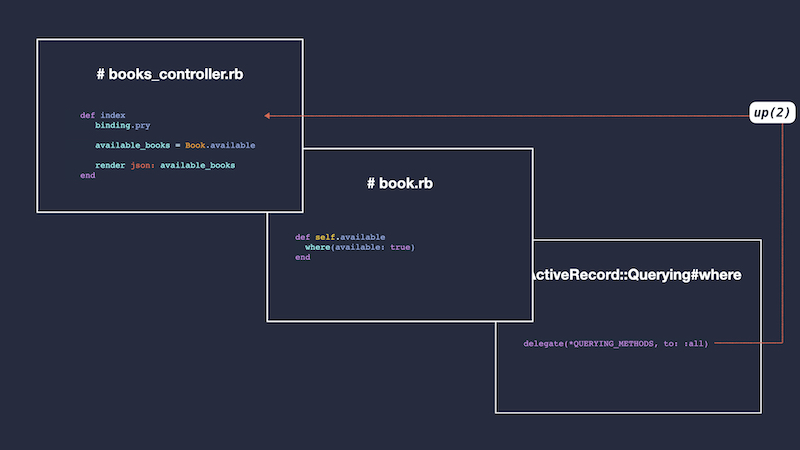
If I type `up` in my console, I'll move up the frames towards my initial breakpoint.
What if I've moved down frames several times? I can either pass the number of frames I'd like to go up as an argument - `up(2)` - or type `up` several times.
 ## Add and remove breakpoints on the fly
### 1) Add a breakpoint from the console: `break`
If I realize, once I'm in my debugging console, that I would have needed another breakpoint, I can add it on the fly with `break line_number`.
```irb
From: (pry) @ line 4 BooksController#index:
01: def index
02: binding.pry
03:
=> 04: available_books = Book.available
05:
06: render json: available_books
07: end
[1] pry(BooksController#index)> break 06
Breakpoint 1: /path/controllers/books_controller.rb @ 06 (Enabled)
01: def index
02: binding.pry
03:
04: available_books = Book.available
05:
=> 06: render json: available_books
07: end
```
I can type `break 06`, resume the execution, and have it paused before the `render json`.
A few things to consider:
- `Breakpoint 1: /path/controllers/books_controller.rb @ 06 (Enabled)` gives me my new breakpoint reference number: `1`. This will come handly later.
- What appears after `Breakpoint 1 ...` is part of my breakpoint's information. Not where my program is currently paused.
Adding breakpoint son the fly makes for a pretty seamless debugging experience. I used to exit the `pry` session, go back to my code, add a new breakpoint, then re-run execution. Let me tell you, `break 06` came as a relief!
### 2) Remove a breakpoint from the console: `break --delete breakpoint_number` or `break -D breakpoint_number`
So, now my program is paused before the line 04, and I know I added a second breakpoint on the line 06:
```irb
From: (pry) @ line 4 BooksController#index:
01: def index
02: binding.pry
03:
=> 04: available_books = Book.available
05:
06: render json: available_books
07: end
```
What if I want to remove this second breakpoint?
First, I want to find my breakpoint's reference by listing all breakpoints with `break`. Then, I can delete the breakpoint with `break --delete breakpoint_number`.
```irb
[1] pry(BooksController#index)> break
# Enabled At
-------------
1 Yes /path/controllers/books_controller.rb @ 06
[2] pry(BooksController#index)> break --delete 1
# Enabled At
-------------
```
`break` outputs the list of all the breakpoints added in the console.
`break --delete breakpoint_number` outputs the list of all remaining breakpoints.
### 3) Show breakpoints information: `break --show breakpoint_number`
```irb
[1] pry(BooksController#index)> break --show 1
Breakpoint 1: /path/controllers/books_controller.rb @ 06 (Enabled)
01: def index
02: binding.pry
03:
04: available_books = Book.available
05:
=> 06: render json: available_books
07: end
```
This is the same output that the one I get after adding a breakpoint.
## Check your latest commands: `history`
`history` gives me a list of all past commands I ran during the current `pry` session.
## Commands and aliases
Finally, here's a handy table with some commands and their aliases.
| command | alias | expected behavior
| --- | --- | ---
| `wherami` | `@` | prints out your current context
| `continue` | `c` | continue program execution
| `next` | `n` | execute the next line in the current stack frame
| `step` | `s` | step execution into the next line
| `break --delete` | `break -D` | delete a breakpoint
| `break --show` | `break -s` | show a breakpoints details and source
There's only one thing left to say: Happy debugging!
Noticed something? [Ping me on Twitter](https://twitter.com/mercier_remi) or [create an issue on GitHub](https://github.com/merciremi/remicodes/issues/new).
Cheers,
Rémi
[^1]: Sorry, just re-read for the umpteenth time Pride and Prejudice.
---
Written by Rémi Mercier (https://remimercier.com/about/), independent Ruby on Rails developer and technical writer.
Original article: https://remimercier.com/pry-byebug-intermediate/
When quoting or referencing this article, please cite "Debugging with pry-byebug: moving in the stack frame" by Rémi Mercier, https://remimercier.com/pry-byebug-intermediate/